Project 03
Quantifying electrolyte fill from ultrasonic cell scans.
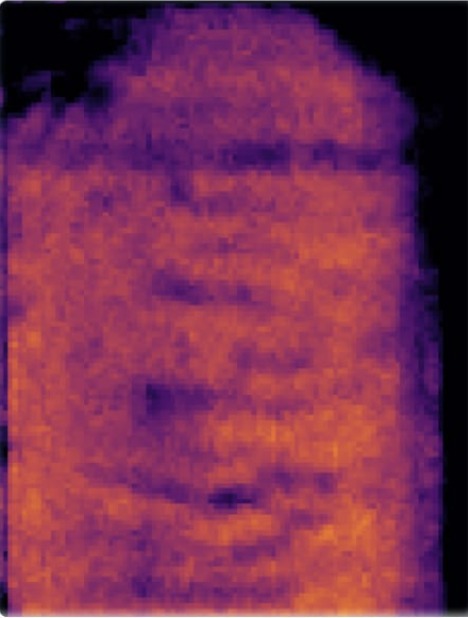
Ultrasonic scanning lets you see inside a battery cell using a non-destructive method. It can reveal how completely liquid electrolyte has wet the electrode stack, which largely decides whether the cell will perform. Reading that image was highly qualitative, so I developed a script that segments the scan with K-means clustering and turns each color's pixel share into a hard percentage.
Problem
Cell quality quantification
The scan works by pulsing high-frequency ultrasound through the width of the cell. Since air has a very low acoustic impedance, the large mismatch at any air gap reflects the sound strongly, while the signal passes cleanly through areas filled with electrolyte. Where there's a dry patch, a trapped gas pocket, or a void, the sound scatters at the interface and little energy reaches the far side.
The scan renders a 2-D mapping of the face of the cell: strong signal = well-wetted, weak signal = air pocket or cell anomaly.
The scan result was still ambiguous, and required a way to quantify wettability — the reading ultimately feeds a pass/fail decision on the cell.
Solution
How it works
The script identifies the colours present in the scan with K-means and measures their area.
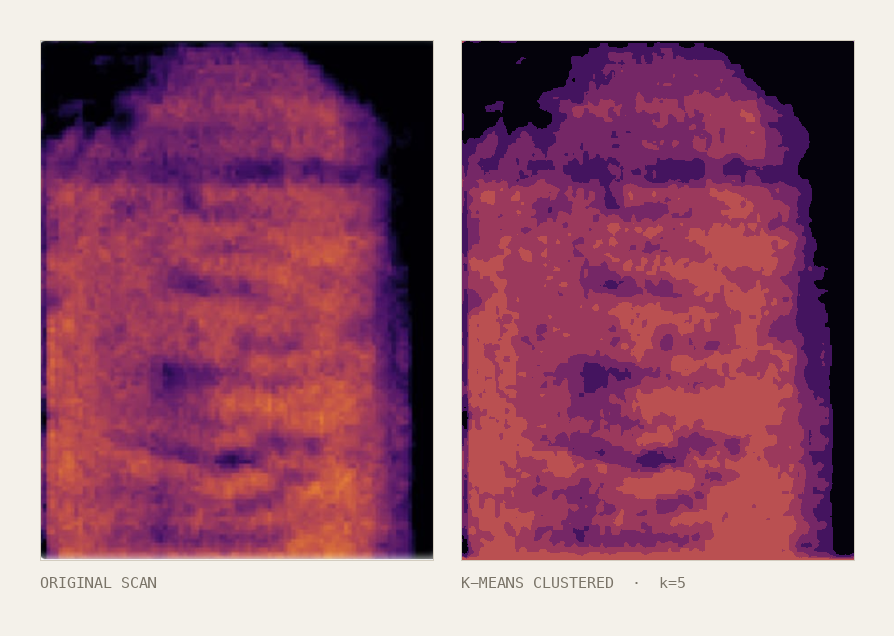
K-means minimizes the total squared distance between pixels and their assigned color center. With the clusters fixed, coverage is just a ratio of pixels in the electrolyte clusters over total cell pixels:
fill% = ( pixels in electrolyte clusters / total cell pixels ) × 100
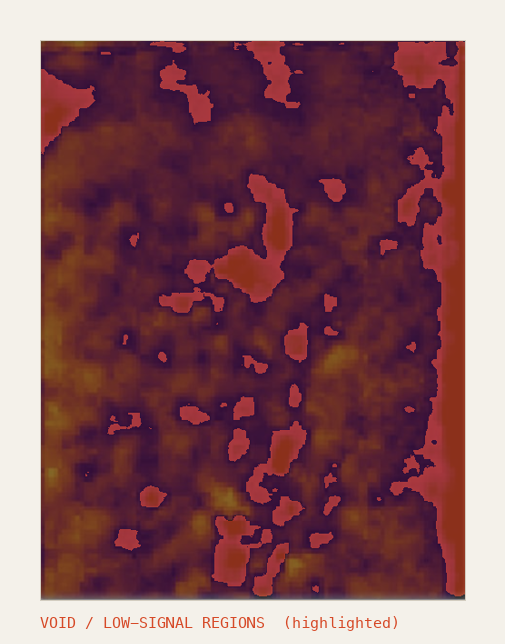
Each color center is then mapped onto the scan's intensity colormap: the bright end (orange/yellow) is strong signal where electrolyte wet the stack; the dark end (deep purple/black) is void or dry.
% Reshape image into a list of pixels (N x 3)
pixels = double(reshape(img, [], 3));

% Find the dominant color groups
[clusterIdx, centroids] = kmeans(pixels, numClusters, ...
    'MaxIter', 300, 'Replicates', 5, ...
    'Distance', 'sqeuclidean');

% Each cluster's pixel share = its % of the cell
for i = 1:numClusters
    clusterPct(i) = sum(clusterIdx == i) / numel(clusterIdx) * 100;
end

% Where does this color sit on the colormap?
% t = 0 (dark / no signal) .. 1 (bright / strong signal)
t = colormapPosition(centroids(idx, :));
if t < voidThresh
    label = "VOID";      % dry / unwetted
else
    label = "FILLED";    % electrolyte present
end
Result
A repeatable percentage instead of a variable judgment call.

Scans shown are representative public-domain examples, run through the same pipeline; proprietary cell data is withheld.
© 2026 Jay Chung